Visualizing the Street Network of Budapest
📬 Get the future posts directly in your inbox:
How can we understand a city through its infrastructure networks? This question was the starting point for my final project in the Data Visualization class taught by Roberta Sinatra. The goal of the class was to gain insight into a data set through visualization.
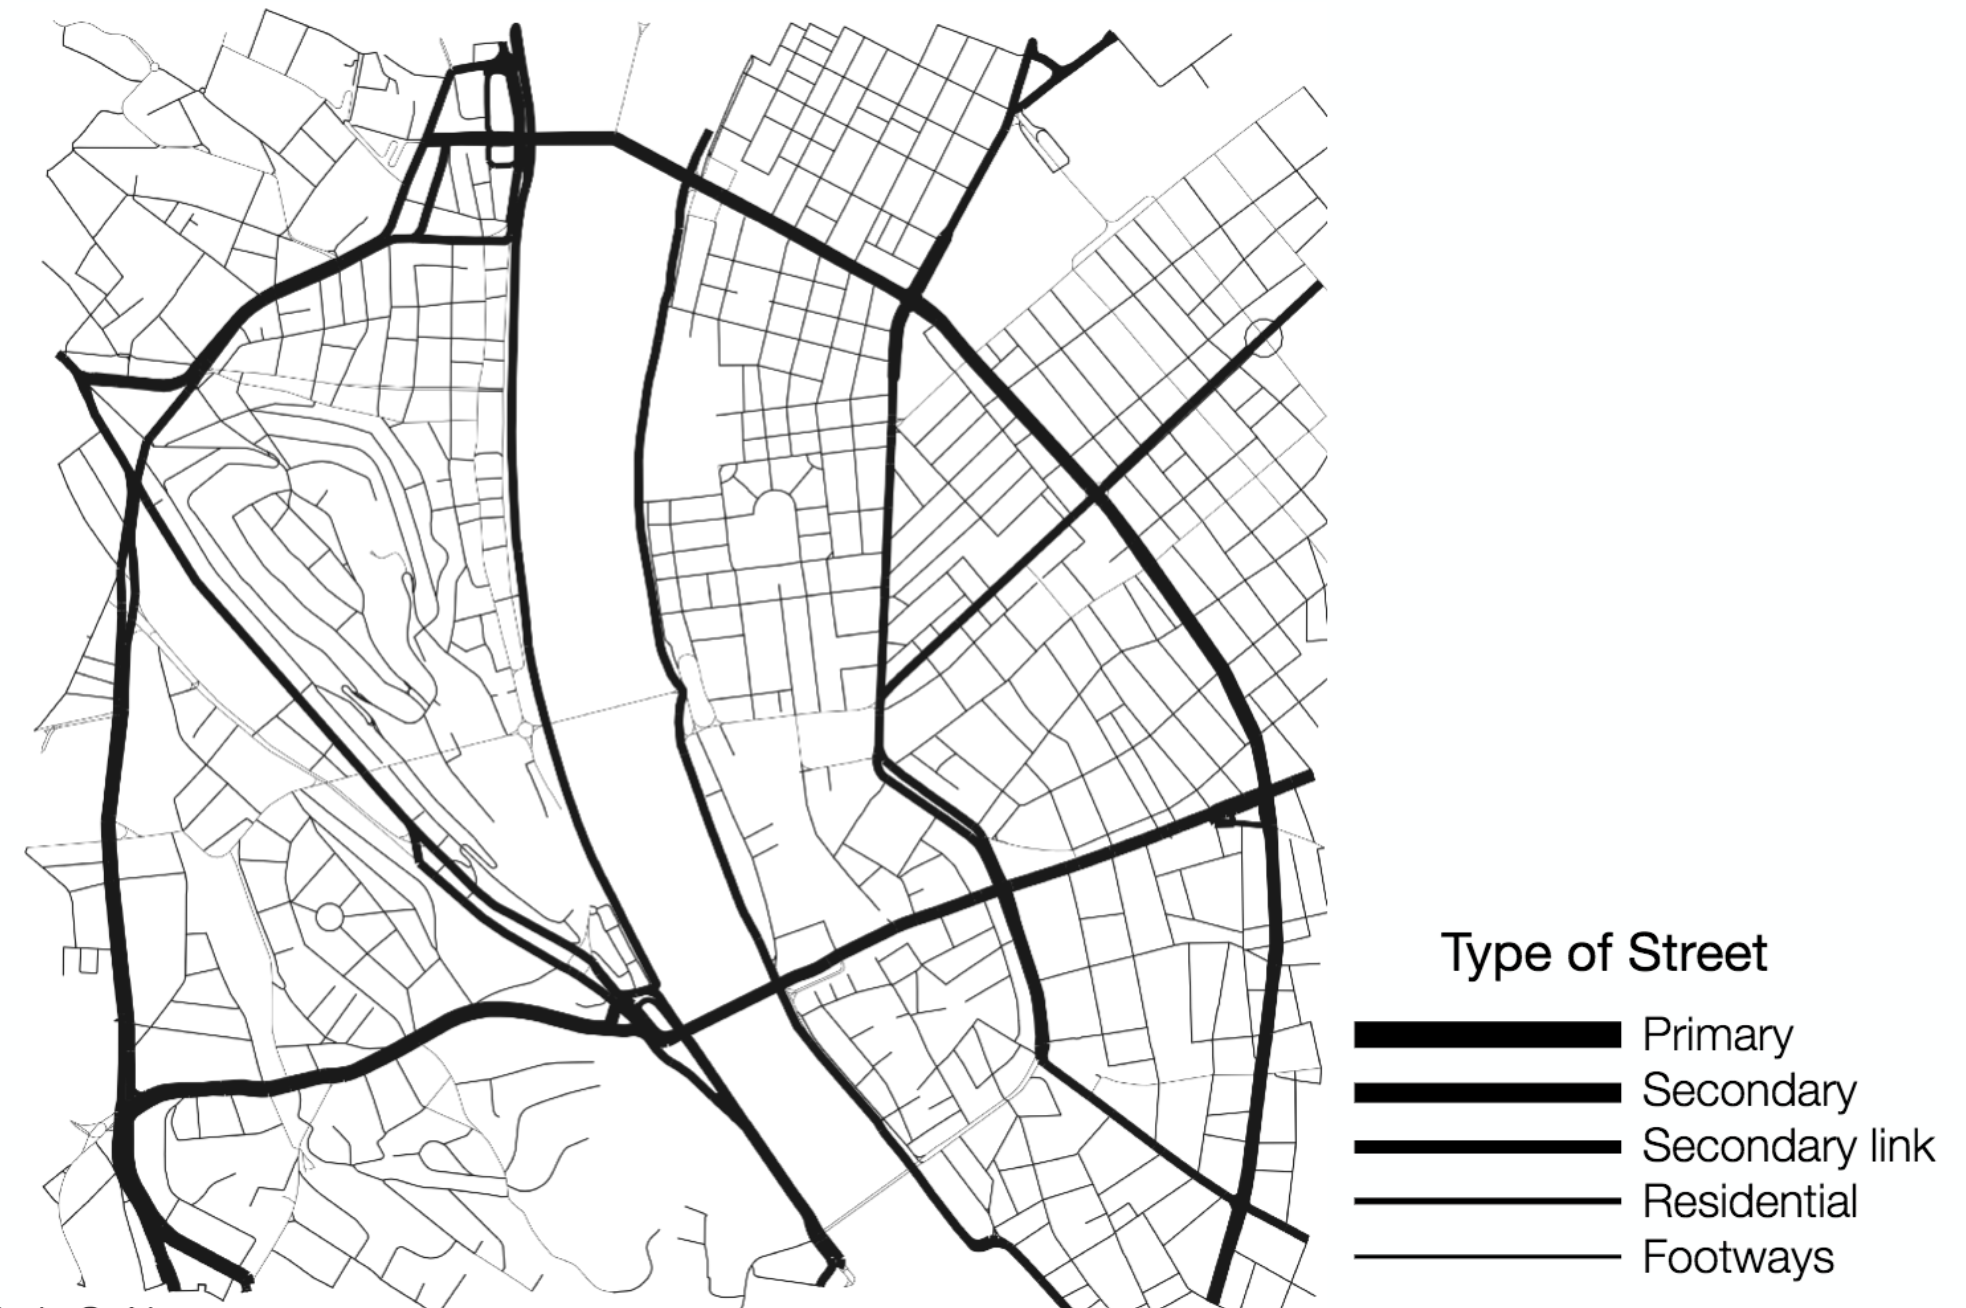
The selected city to analyze was Budapest, an obvious choice now that I’m living here and also because I wanted to better understand the city. To get the data and build the network I used (OSMnx)[https://github.com/gboeing/osmnx], a python library developed by (Geoff Boeing)[https://geoffboeing.com/]. I used OSMnx to download the city data from OpenStreetMap and build the network using the streets as edges and the intersections between two streets as nodes. For the project, I worked with 4 square kilometers of Budapest city center. First I visualized the city network assigning the width of the edges - streets - according to the type of street, to show where the main streets are in the city and how they are connected.
As we know from the network science literature, a network’s topology determines its resilience, so the next step to better understand Budapest, a city with a river in the middle, was to work with the network and test its attack tolerance. In short, I calculated the betweenness centrality of all the street intersections of the network, drew the network with the size of the nodes according to their betweenness centrality and removed the one with the highest betweenness one by one. This approach lets us simulate how the network changes if we “close” or remove the intersection that is in the middle of the shortest paths between all the other intersections.
The video shows us this simulation of calculating the betweenness centrality and removing the nodes with the highest one. It also shows the fraction of nodes removed and how many connected components the network has, and we can observe that only removing less than 2% of the nodes leads to more than 3 different connected components in the network, meaning that we are isolating some parts of the city. The most important intersections that hold together the street network of central Budapest correspond to the bridges that connect Buda and Pest over the Danube: Margaret Bridge, Chain Bridge, and Elisabeth Bridge.
Visualizations such as the one developed in this project let us imagine new possibilities to work with and better understand urban networks and complexity in cities using novel technologies and approaches from network science together with urbanism, city planning, sociology and other disciplines.
This post was originally published on the Department of Network and Data Science Blog
📬 Get the blog posts directly in your inbox:
💬 Join the conversation:
Keep to conversation with a comment or reach out in my social networks.