Finding similarities in global cities using their mobility infrastructure
📬 Get the future posts directly in your inbox:
When thinking about cities, it is a common place to think about how we move in them. We tend to associate Amsterdam with bicycle mobility, and Los Angeles as a city designed for cars. Using data, one can move from the common place to a data-driven approach, allowing us to identify these mobility infrastructure patterns and have a better overview of what is the transport that a city is optimized for.
The “urban fingerprint” is a technique developed to better understand how different modes of transportation are interconnected in different cities around the world. It takes the multimodal mobility network of a given city, and measures how many of its intersections are accessible by different mobility options; In a multimodal city, we expect to find many transport hubs that connect different layers, such as train stations with bicycle and street access.
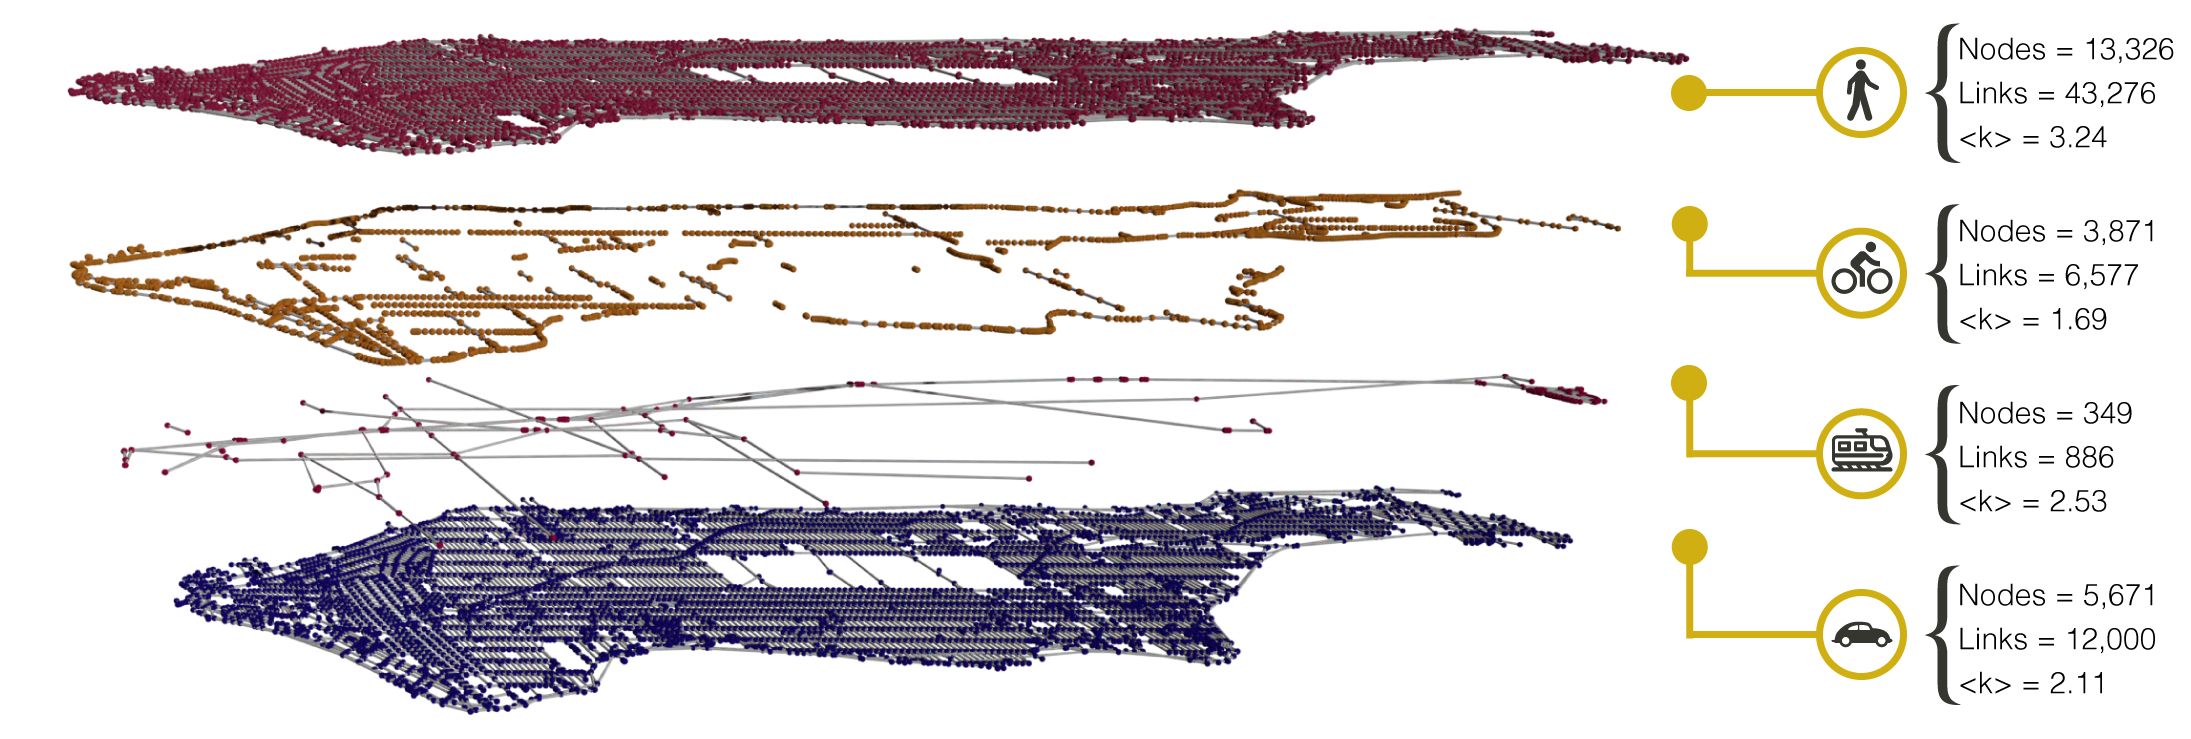
Even in the optimal multimodal city, there will be a high heterogeneity of node actives due to the different speeds and nature of transport modes, for example, there will be less nodes for train or subway connections than for a bicycle network. A good way to evaluate the multimodality of a city is to compare it with other cities.
For this approach we captured the “urban fingerprint” of fifteen cities in the world, and then used a k-means algorithm that was fed with one vector for each city containing the percentages of nodes active in each possible configuration. The algorithm then found six different cluster, or types of cities, based on their multimodal mobility infrastructure.
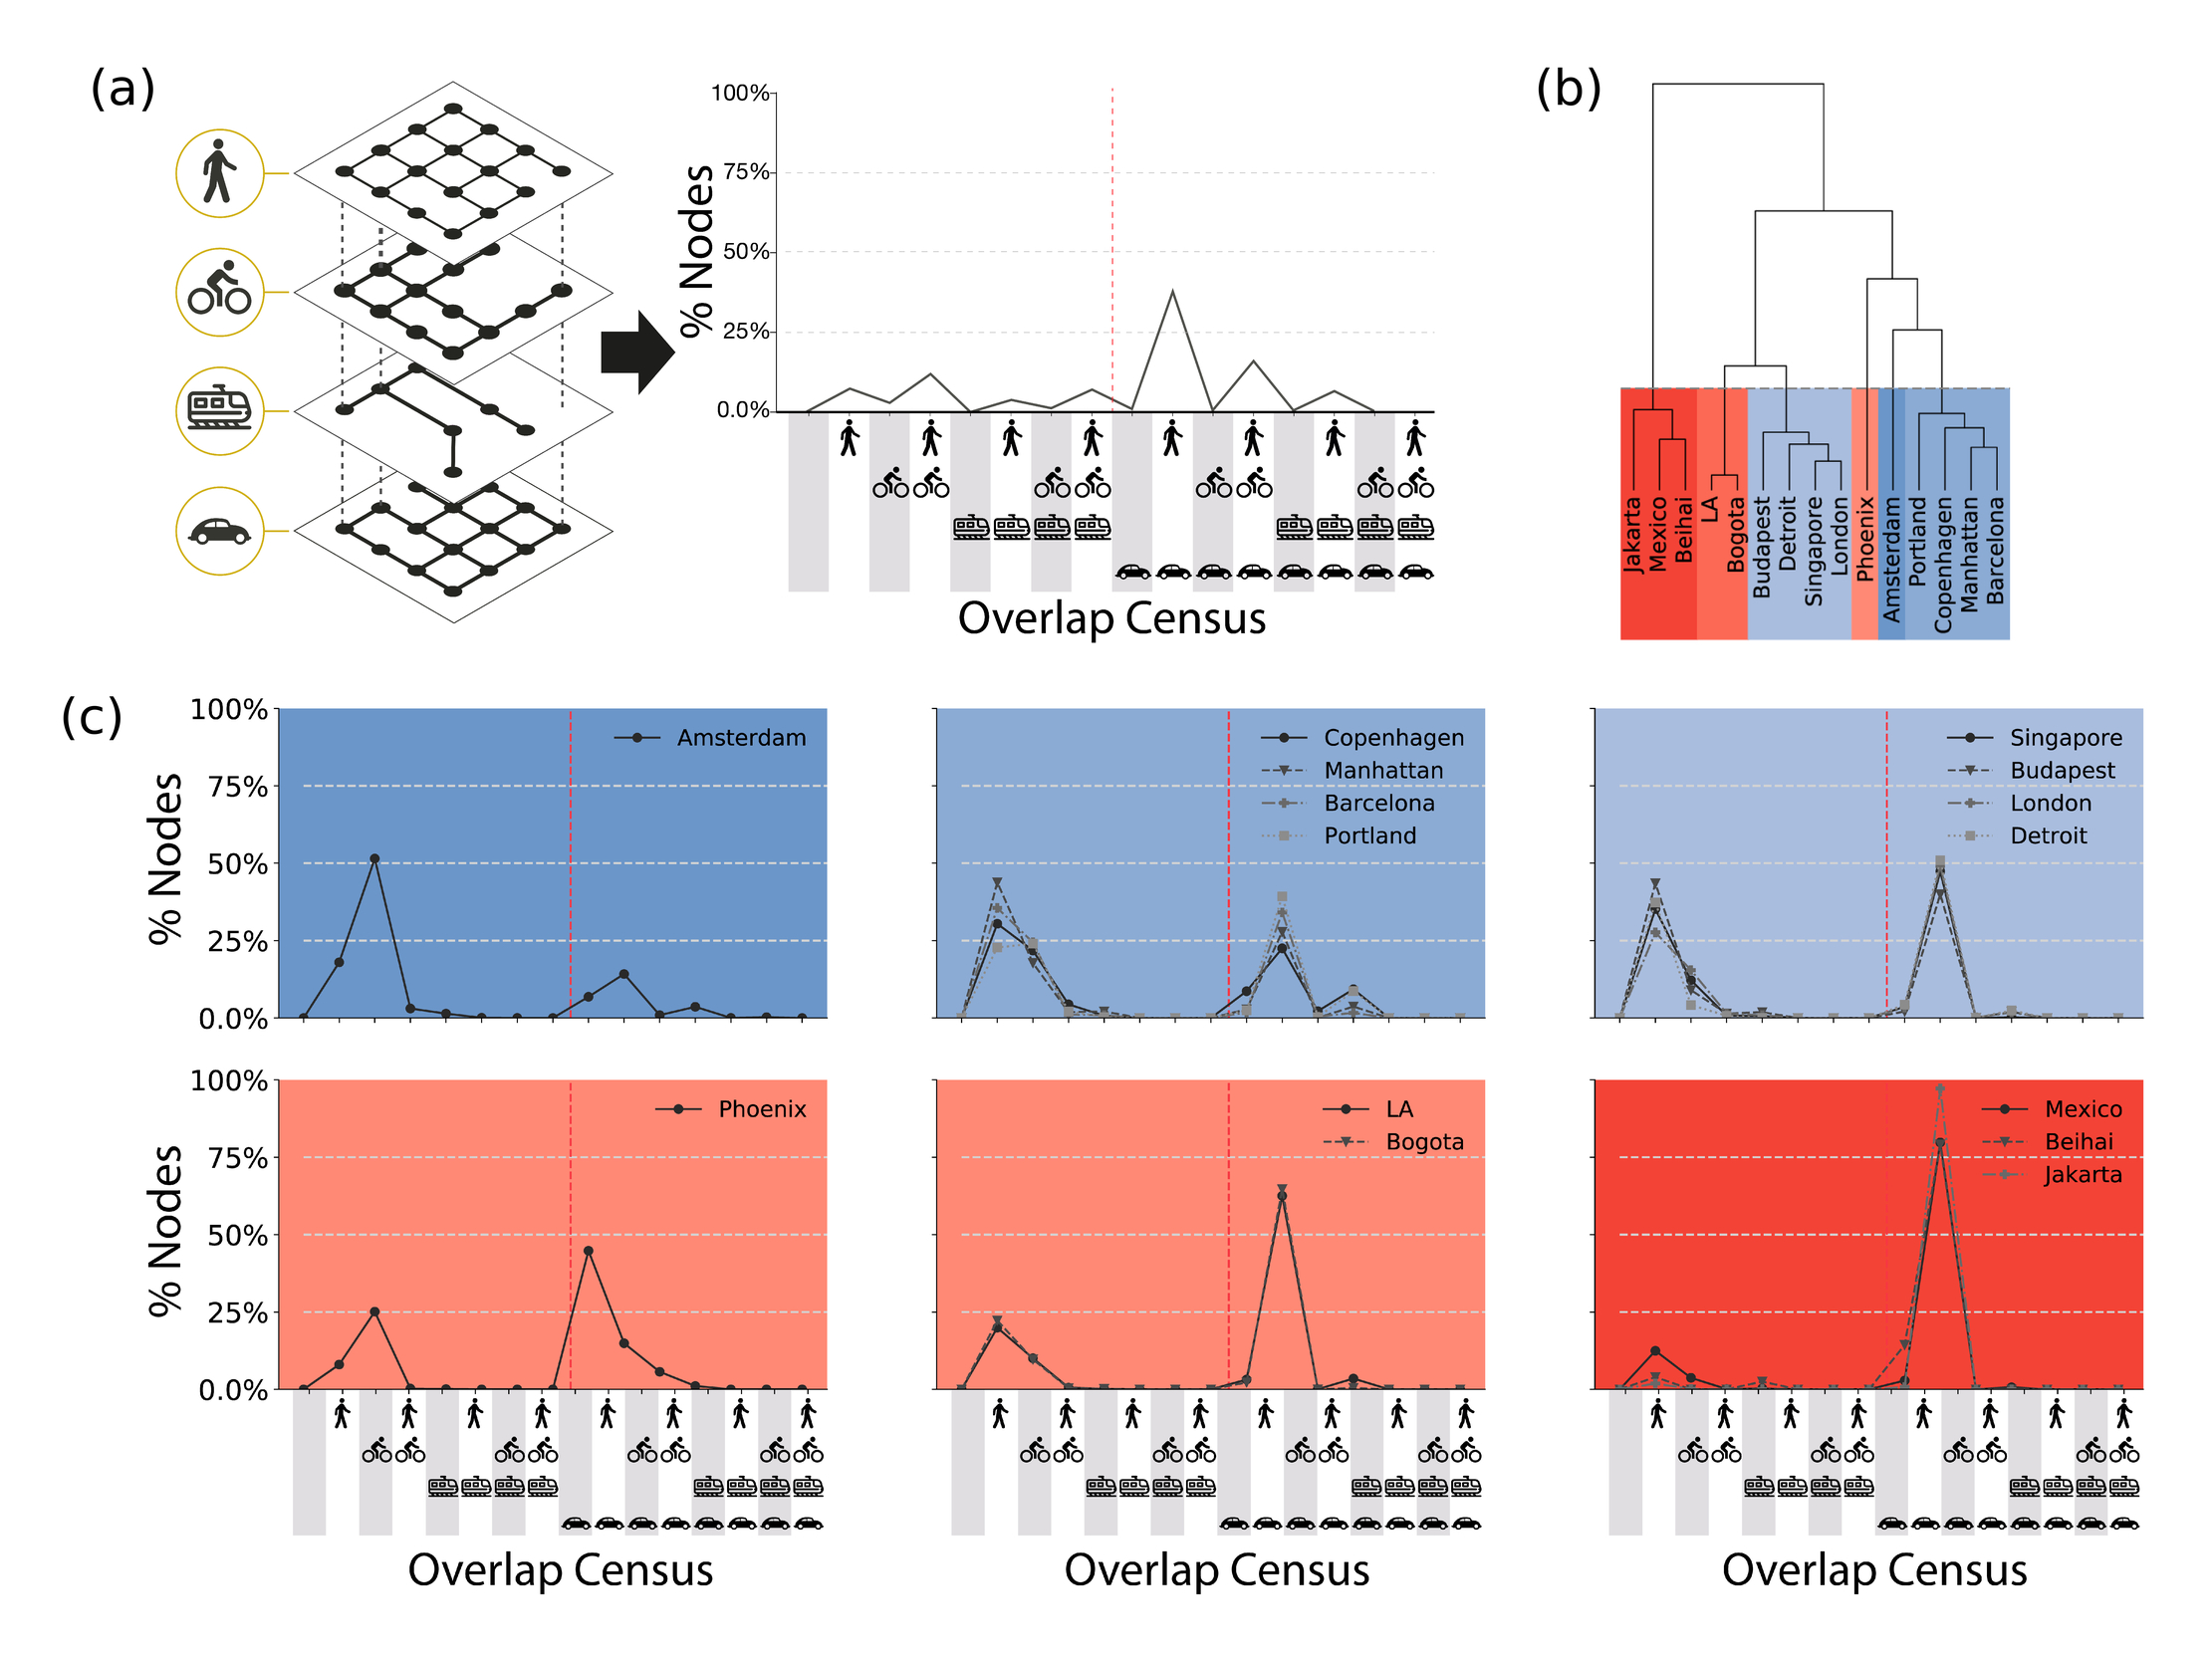 (a) Schematic of multiplex layers in a city (left) and its transformation to the overlap census (right). (b) Clusters of cities based on similarity of their overlap census. (c) Overlap census for cities in each cluster. The first one corresponds to Amsterdam (the city with most active nodes in bicycle-only configurations). The Copenhagen-Manhattan-Barcelona-Portland city cluster has many active nodes in pedestrian-only and bicycle-only configurations, representing an active mobility city. The clusters of Los Angeles-Bogota and Mexico-Beihai-Jakarta are car-centric.
Using this technique, cities can be divided into distinct classes based on their transportation priorities, with some cities focusing more on active mobility infrastructure, while other cities prioritize a car-centric approach. The concentration of nodes in one layer or one configuration of the city informs not only about the mobility character of the city, but also unveils the importance of explicitly considering overlooked layers and their interconnections.
By understanding the ways in which different modes of transportation overlap and interact in a city, planners, city officials, and stakeholders can make more informed decisions about infrastructure investments and transportation policies. Additionally, the overlap census technique can be used to compare different cities and identify best practices for improving multimodality, and reduce car dependency.
By using the overlap census technique, cities can better understand their transportation networks and make more informed decisions about transportation planning.
📬 Get the blog posts directly in your inbox:
💬 Join the conversation:
Keep to conversation with a comment or reach out in my social networks.