Data for clean air
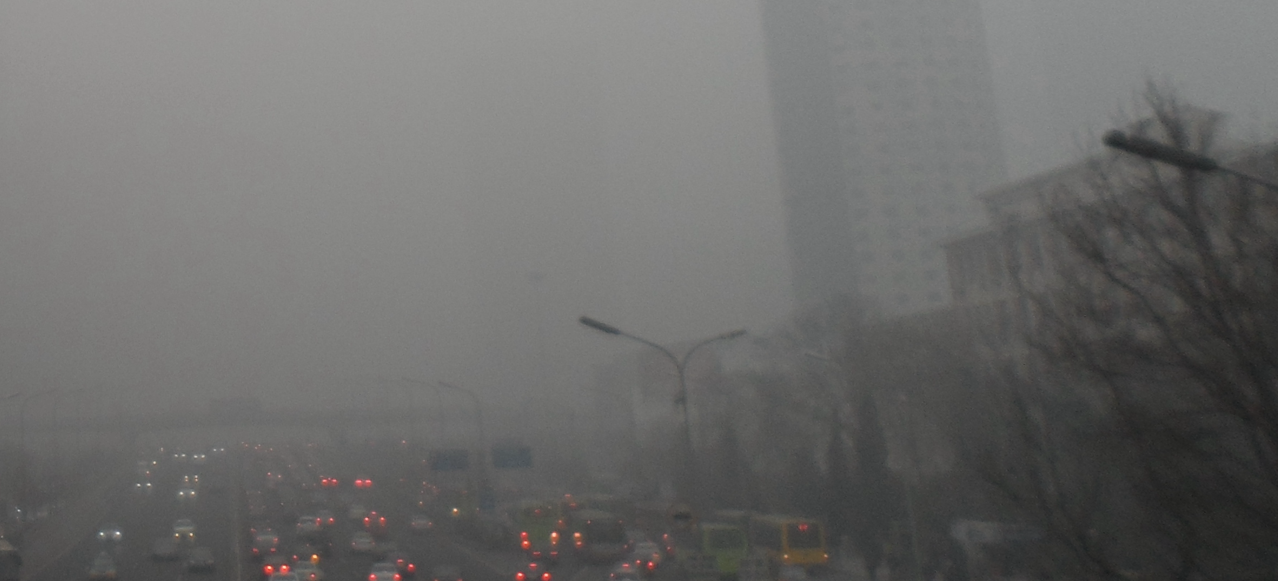
This project was part of a larger initiative to think about public buildings as opportunities to mitigate climate change. Specifically, we were asked to stablish an air quality baseline in the public transport stops of a new BRT line in Guadalajara. The idea behind was to use this baseline to measure the change in pollutants after the new transport system started operating. As the new route goes around the city we where faced with the challenge to find the best way to provide measurements for each one of the 42 stations of the system.
The solution to provide such a baseline was to leverage open data from different air quality monitor stations in the city. Once that we got the data we established a grid along all the city to interpolate the data from the monitor stations. Although this method overlooks air dynamics and how the pollution moves along the city, it provided us with an estimate of the situation all around the city.
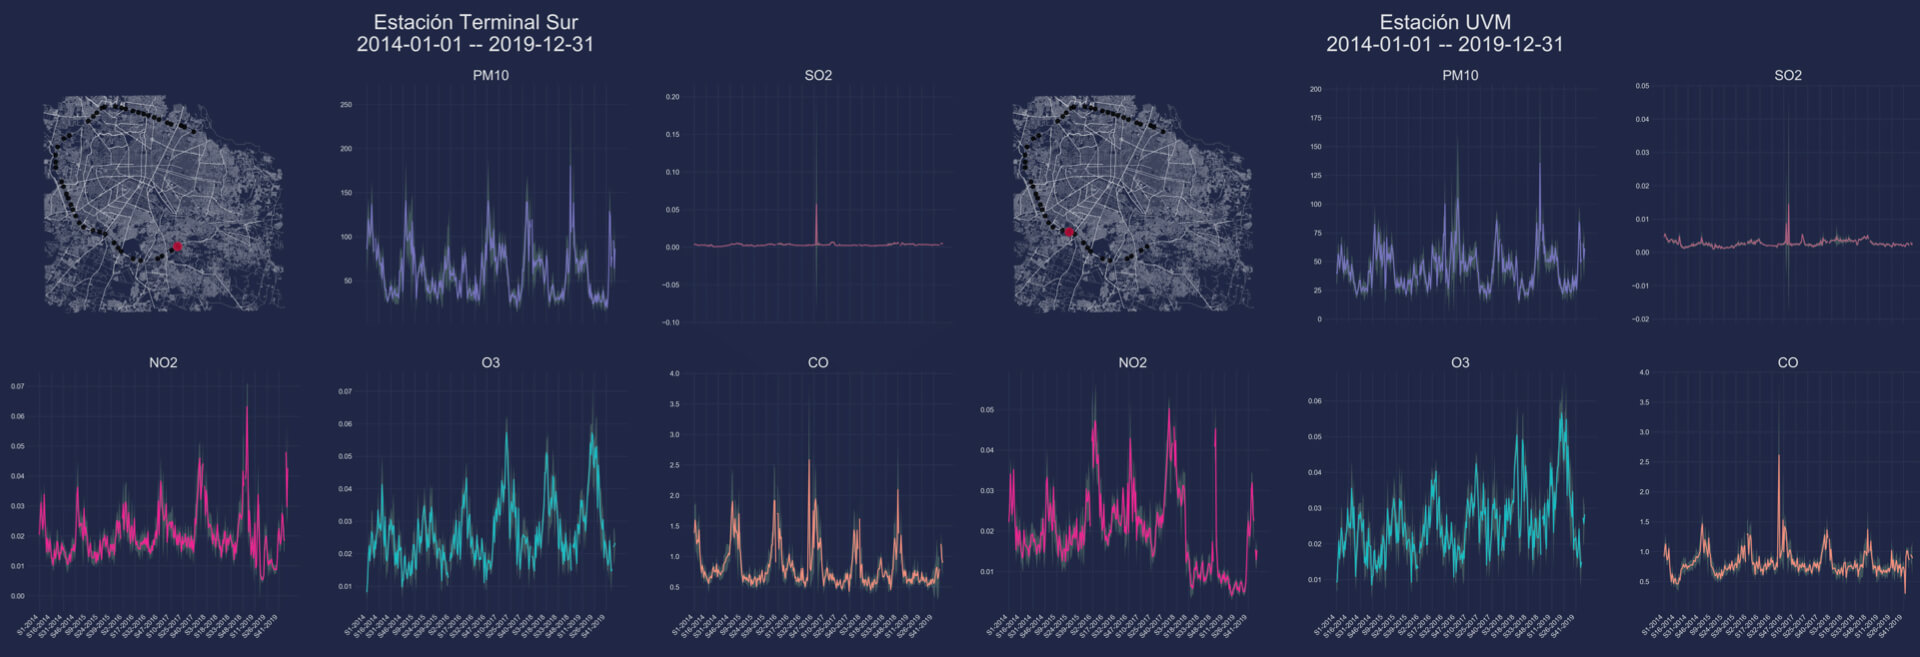
Following a similar interpolation approach, we interpolated the data from the monitor stations into each one of the new public transport stations. We applied the spatial interpolation for all the data produced in the last five years to observe how the different pollutants behave in a larger temporal scale and control for changes due to weather and other social dynamics (e.g. summer break and holiday periods).
Technology stack
The project was developed with the following technologies.
- Python
- OSMnx
- GeoPandas
- Matplotlib
Follow me:
Keep to conversation and reach out by following me in my social networks