Week in Review 2023-02-06
📬 Get the future posts directly in your inbox:
January is gone. The last days of January and firsts of February came with interesting content. But before we go into it, a quick review of the week. Last week I was mostly focused working on a refactor of a code, and taking care of some reviews. I find refactoring code a good learning experience to make the code better, more clean, readable. Of course, having tests in place helps a lot while doing the refactor to make sure the things I break are being taking care of.
This week I also published a post about evaluating how fragmented the bicycle infrastructure in a city is. The post combine two of my favorite topics, bikes and code. And the cherry on the top: data visualization.
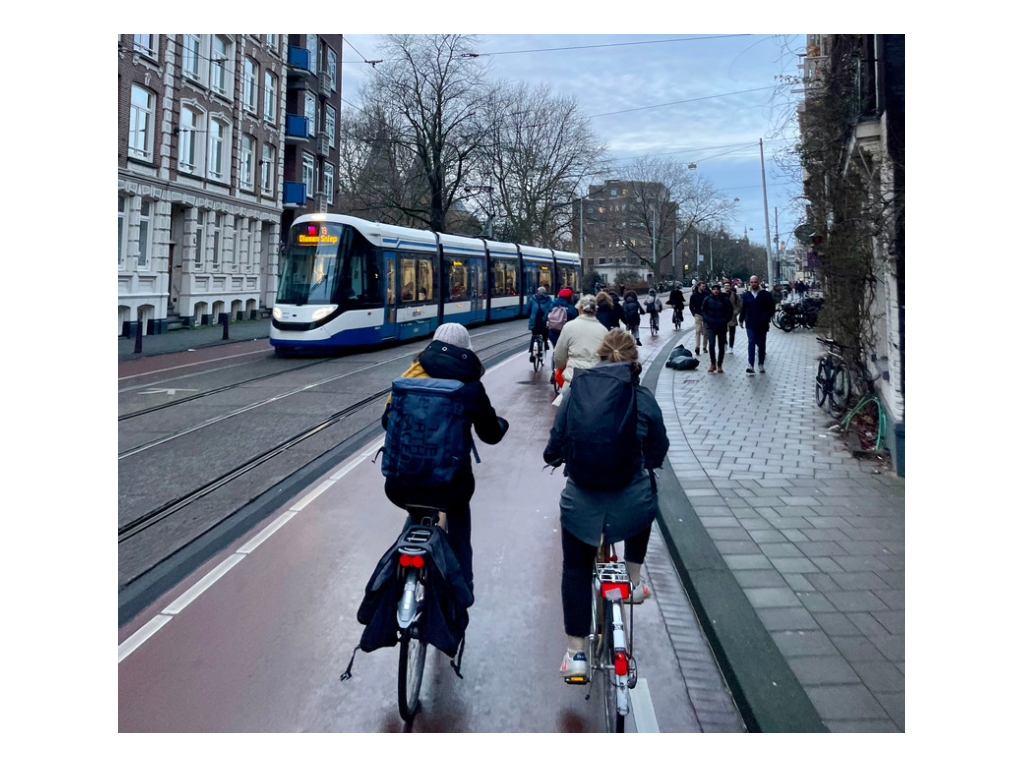
Writing about bicycle infrastructure was a good topic, as during the week I got into some beautiful traffic jam, I know, is it possible to have good traffic jams? Yes, just look at it:
 Tram + bikes + pedestrians, perfect combo for a livable city.
As all the week, last one came with interesting links, from urban related topics as: a tour around Amsterdam’s new underwater bike park, a study about happiness in cities, and data visualization of Paris’ cycling evolution, to scientific ones, like an interview with Giorgio Parisi on complex systems, and an animated explanation of the A* algorithm. Hope you enjoy!
- Entering the underwater bike park… // An overview by Anna Holligan on the new Amsterdam underwater bike park.
- Paris cycling evolution between 2020 2023 via @citiesbybike // pretty cool evolution of Paris, and also very fortunate that we can see how a city evolves.
Web
- Thoughts on complex systems: an interview with Giorgio Parisi // Interesting interview on complex systems with Giorgio Parisi, Nobel Laureate in Physics for his work on understanding complex physical systems.
- Where people are happiest -and saddest- in big cities. // Using neural networks to analyze geolocated tweets and identify emotions. By using geotagged tweets it was possible to identify the places and areas where people was posting happier and saddest tweets. It’s no surprise that areas with parks and public space triggered the most positive feelings.
Weeknotes
Youtube
- The hidden beauty of the A* algorithm // Nice explanation of how the Djikstra and A* algorithms work, specially applied to transport networks. Give it a look!
🤖 This post was generated automatically by the weekly script, using content curated in the issues of my repo in GitHub
📬 Get the blog posts directly in your inbox:
💬 Join the conversation:
Keep to conversation with a comment or reach out in my social networks.